You’ve migrated your code to Swift 6+ and Strict Concurrency. The compiler is happy, there are no warnings related to concurrency, and your app works as expected. However, some parts feel slow or you’re just looking to optimize the performance. Where to start?
Measurement is the foundation of performance improvements
You can only increase the performance if you know your baseline. Being able to properly measure your code is essential to be able to determine performance optimizations. How would you otherwise know something improved?
In this lesson, we’re going to look into Xcode Instruments for Swift Concurrency. I’ll give you some basic fundamental guidance along the way, since you might not all be familiar with Xcode Instruments. Eventually, you should be able to analyze your code using Xcode instruments and find potential areas of code improvements.
Note
Xcode instruments provides several performance insights. In this lesson, we’ll optimize a sample application step-by-step. In the next lesson, we’re going to look at reducing suspension points specifically.
Sample App: Gradient Wallpaper Generator
For this lesson, I created a sample application. It’s a gradient wallpaper generator that currently generates a fixed number of wallpapers when you press the button.
When you run the app in debug mode, you’ll notice that there’s no progress bar visible and the UI is blocked during the generation:
Yes, it really is that slow!
In the sample project, you’ll find two folders:
- Bad Performance
This folder contains the files that are not optimized for performance. - Good Performance
This folder contains the performance optimized files.
At any time, you can switch from the bad performance to the good performance by adjusting ConcurrencyPerformanceApp.swift:
@main
struct ConcurrencyPerformanceApp: App {
    var body: some Scene {
        WindowGroup {
            BadGradientsGeneratorView()
        }
    }
}
However, I encourage you to start with the bad example code and follow along this lesson for optimizations.
What to look for when doing performance optimizations
Before we dive into Xcode Instruments, I want you to know what to look for when you’re optimizing performance. In practice, most issues fall into a few common buckets:
- UI hangs
Long pauses where the interface stops responding because too much work is happening on the main thread. - Poor parallelization
Heavy work is funneled into a single task rather than split across multiple tasks that can run in parallel. - Actor contention
Tasks are forced to wait on an actor that’s busy handling other work, resulting in unnecessary suspensions and delays.
Luckily, Xcode instruments allows us to indicate each of those and help us indicate where to apply performance improvements.
Profiling your app using instruments
Note
This is an advanced lesson, and Xcode instruments are not for beginners. It’s impossible for me to explain the fundamentals of instruments in this lesson, so I’m assuming you have basic knowledge of how they work.
You can start profiling your app using instruments by pressing CMD + I or Product → Profile. This will launch Xcode Instruments and, as long as your scheme is configured as default, run your app in release mode. Due to this, you’ll notice your app might perform slightly better compared to running a debug build.
Once the build completes, you’re asked to select an instrument template. These are predefined templates, and each template contains a set of instruments. These instruments give you insights into the performance of your app’s code.
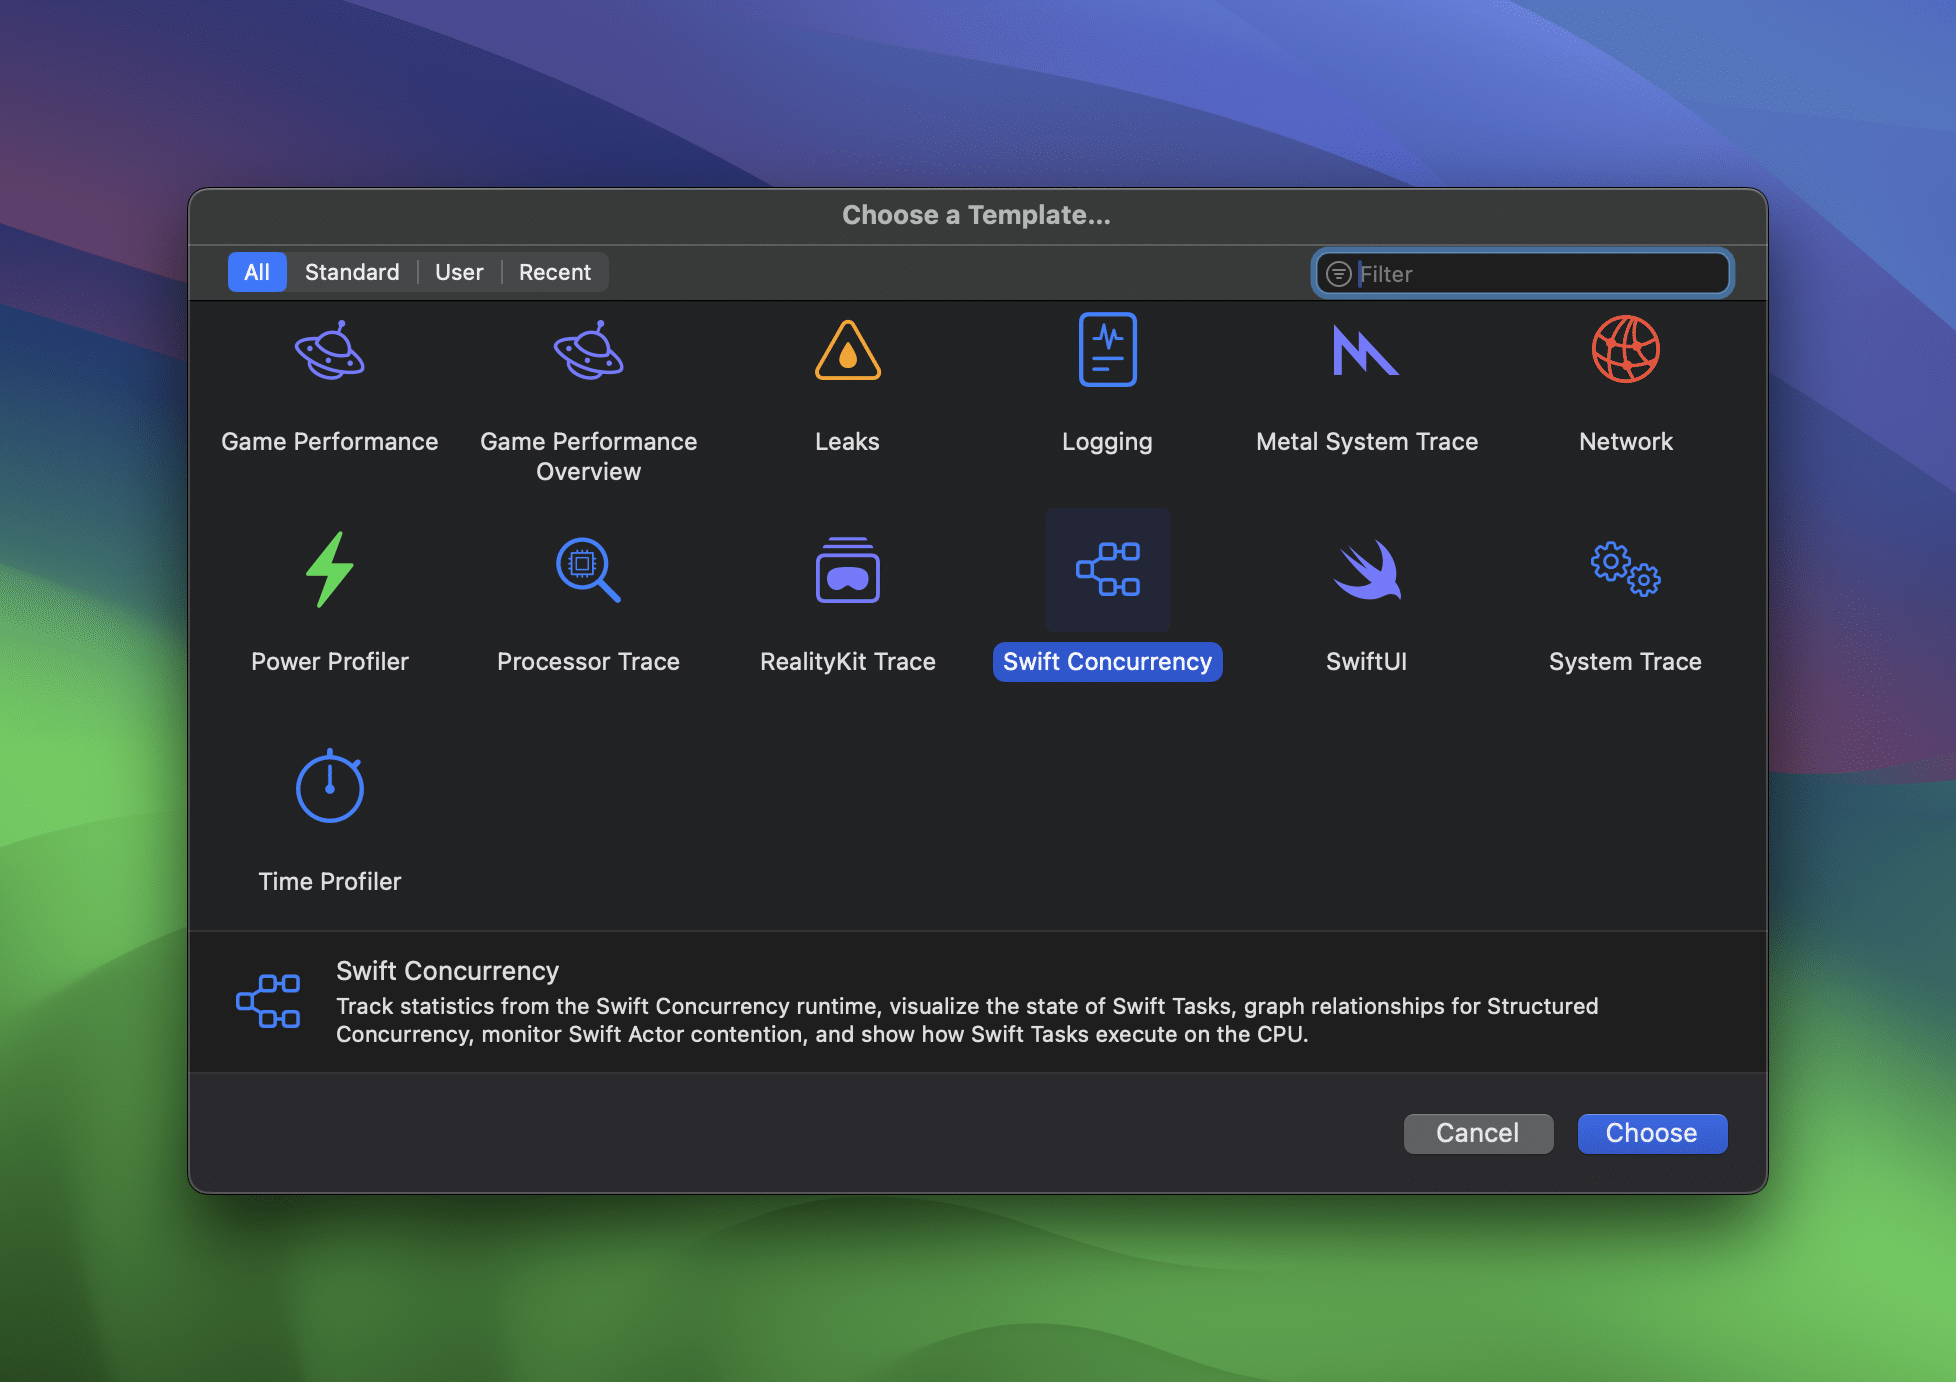
In this lesson, we’re going to select the Swift Concurrency template. This will open up a new window, with a recording button in the top left corner.
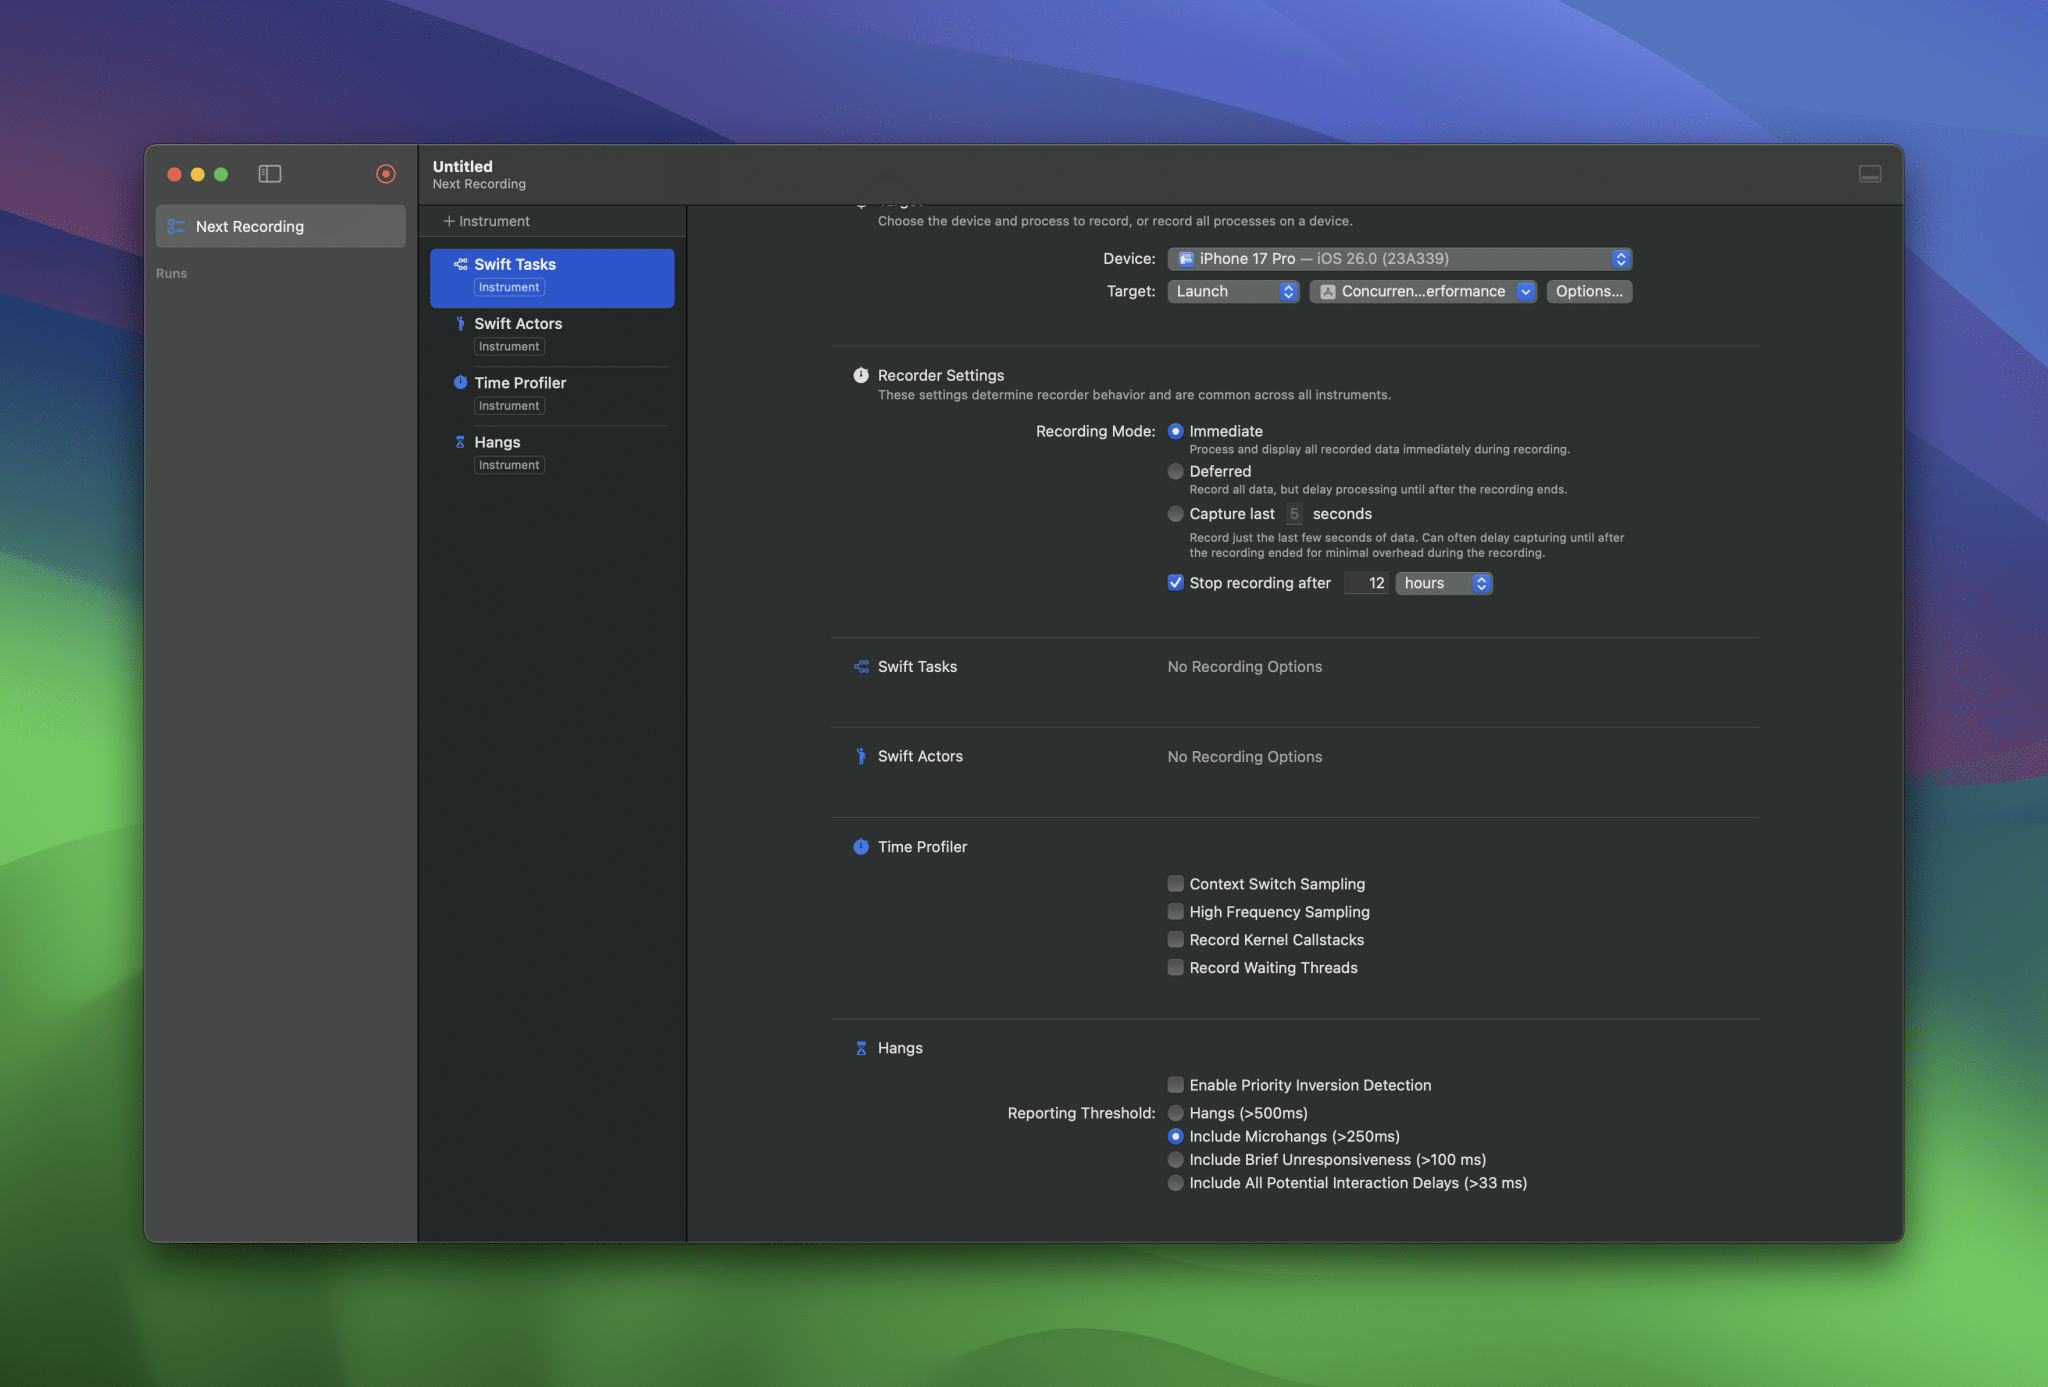
On the lefthandside, we can see a few Swift Concurrency specific instruments:
- Swift Tasks Instrument
Keeps track of running, alive, and total tasks. Visualizes the lifetime and state changes of each task. - Swift Actors Instrument
Shows any actor execution and queue size.
Running our bad state application using Instruments
Let’s have a look at the current state of our application.
- Start recording inside instruments
- Press the Generate Wallpapers button
Here’s the result inside instruments:
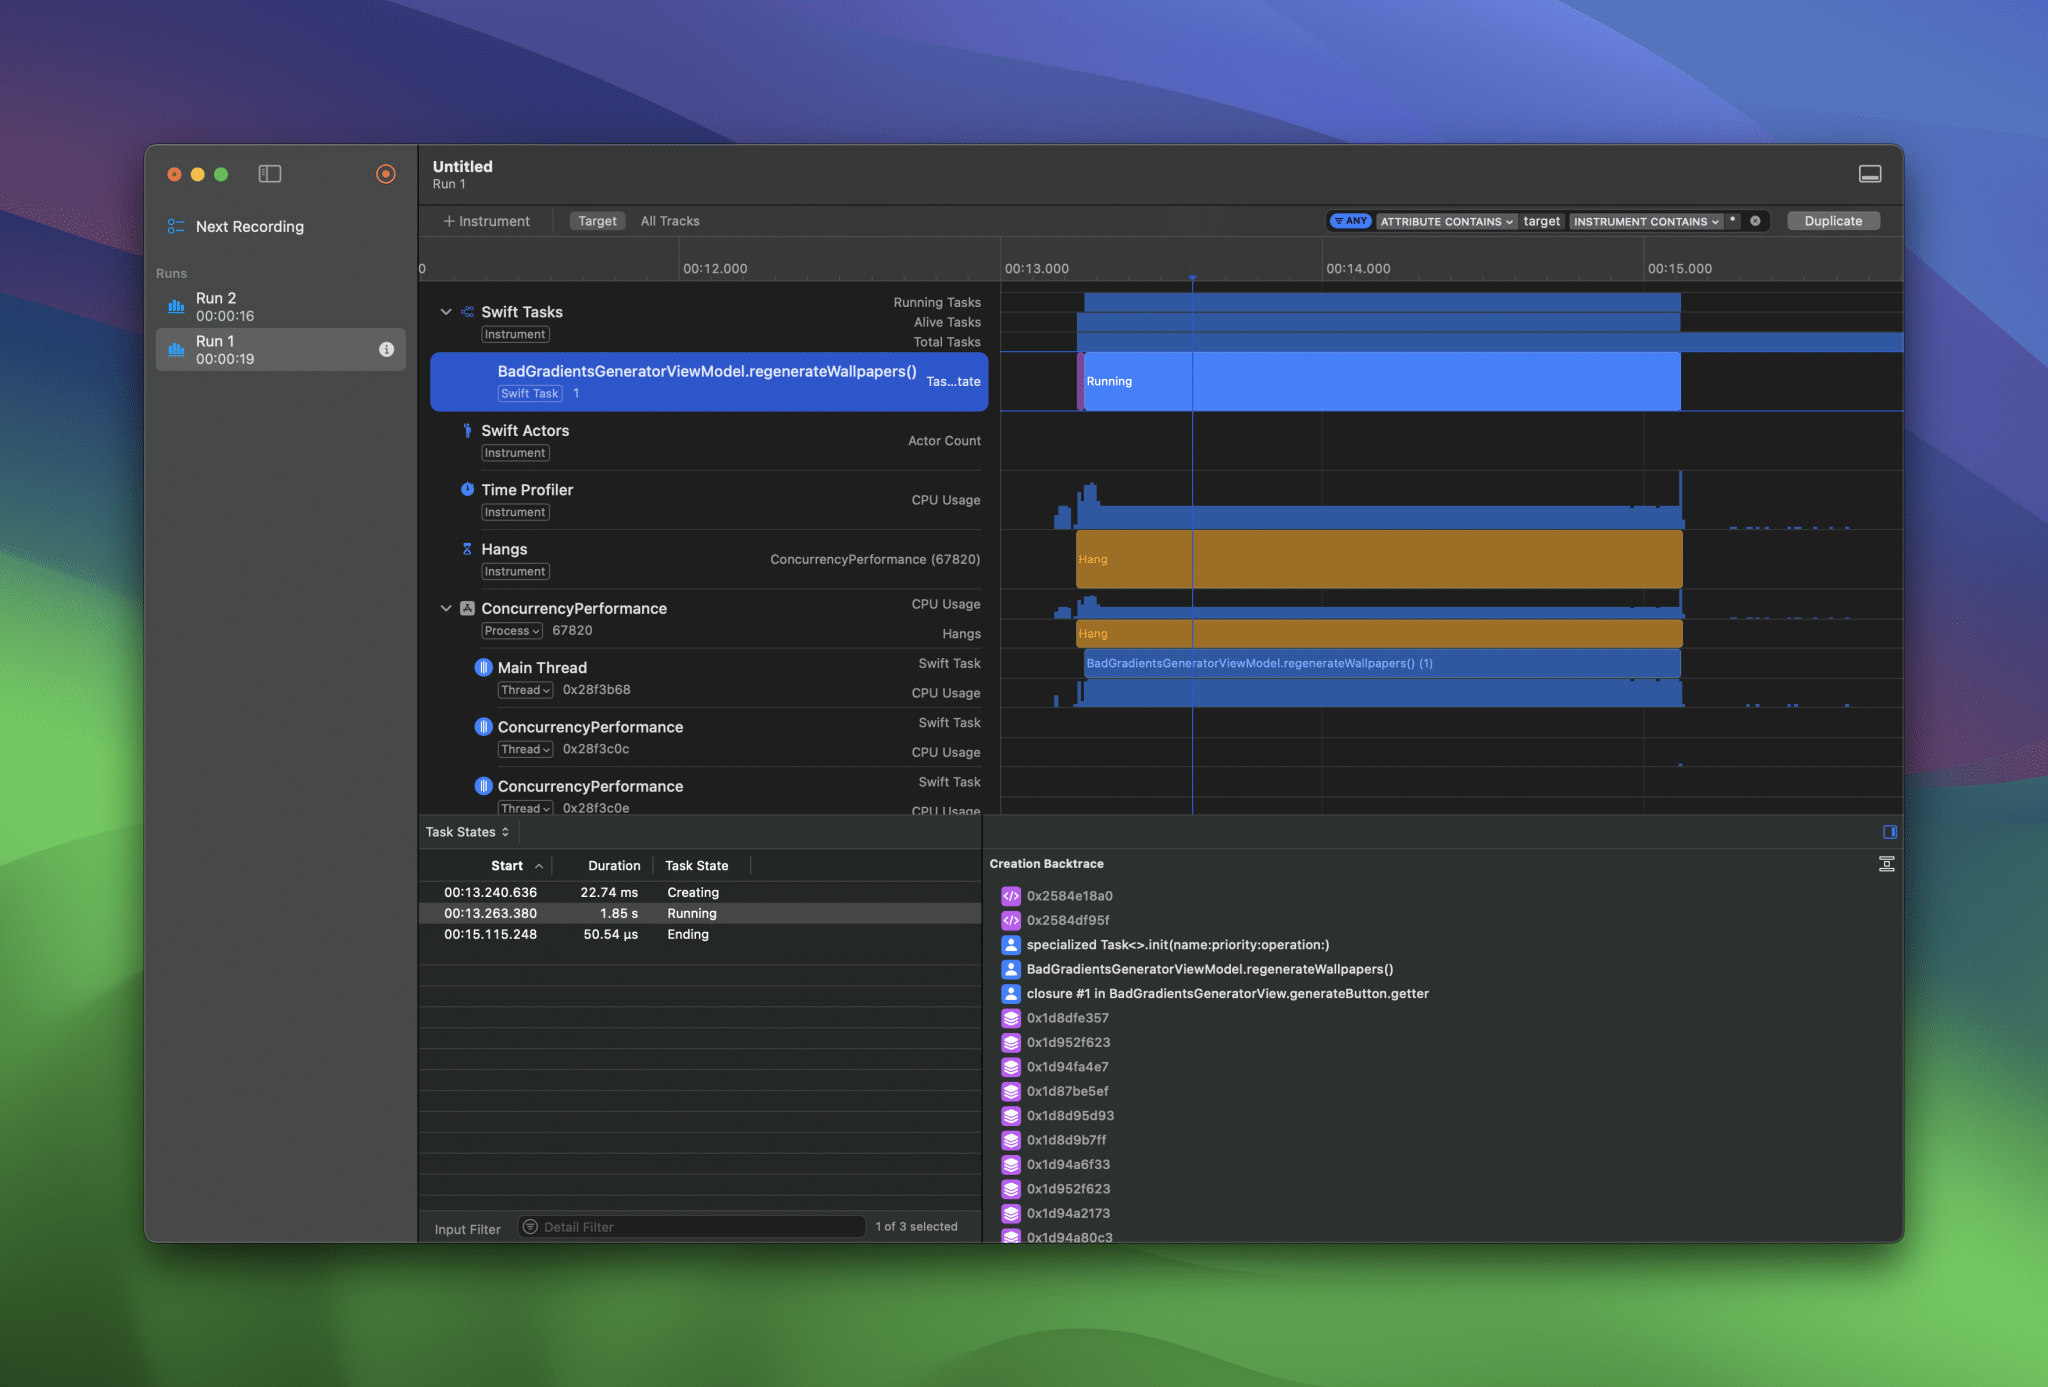
There are a few things to point out:
- There’s a long hang taking place, caused by the blocked main thread
- A lot of the work is happening on the main thread. In fact: all the work!
- While we generate multiple wallpapers, the total number of tasks is 1
These insights give us a few potential improvements:
- Wallpaper generation needs to be done in the background
- We should better optimize for parallelization
The Swift Tasks instrument shows that our regenerateWallpapers method is the root cause. Let’s have a look at this method:
@MainActor
@Observable
final class BadGradientsGeneratorViewModel {
    let numberOfWallpapersToGenerate = 100
    var wallpapers: [Wallpaper] = []
    var isGenerating: Bool = false

    func regenerateWallpapers() {
        wallpapers.removeAll()
        isGenerating = true

        Task {
            for _ in 0..<numberOfWallpapersToGenerate {
                let generator = BadGradientWallpaperGenerator(
                    width: 640,
                    height: 360,
                    controlPointCount: 2,
                    nearestPointsToSample: 1
                )

                let image = generator.generate()
                wallpapers.insert(Wallpaper(image: image), at: 0)

                if self.wallpapers.count == self.numberOfWallpapersToGenerate {
                    self.isGenerating = false
                }
            }
        }
    }
}
While the compiler is happy, our build succeeds without warnings, we do have a problem in this code. The task inherits isolation context from BadGradientsGeneratorViewModel, which is attributed with @MainActor. But that’s not all! Our project’s default actor isolation is also set to MainActor, which means that our BadGradientWallpaperGenerator runs on the main actor by default:
/// This is not marked with nonisolated, so it runs on the main actor by default.
struct BadGradientWallpaperGenerator {
    // ...
}
Moving work away from the main actor
The first step you might consider is moving away from the main actor. We add nonisolated to our BadGradientWallpaperGenerator:
nonisolated BadGradientWallpaperGenerator {
    // ...
}
We introduce a separate actor to ensure wallpaper generation happens in the background:
actor WallpapersGenerator {
    func generate() -> Wallpaper {
        let generator = BadGradientWallpaperGenerator(
            width: 640,
            height: 360,
            controlPointCount: 2,
            nearestPointsToSample: 1
        )

        let image = generator.generate()
        return Wallpaper(image: image)
    }
}
And we rewrite our view model to make use this new generator:
@MainActor
@Observable
final class BadGradientsGeneratorViewModel {
    let numberOfWallpapersToGenerate = 100
    var wallpapers: [Wallpaper] = []
    var isGenerating: Bool = false

    let wallpapersGenerator = WallpapersGenerator()

    func regenerateWallpapers() {
        wallpapers.removeAll()
        isGenerating = true

        Task {
            for _ in 0..<numberOfWallpapersToGenerate {
                let wallpaper = await wallpapersGenerator.generate()
                wallpapers.insert(wallpaper, at: 0)

                if self.wallpapers.count == self.numberOfWallpapersToGenerate {
                    self.isGenerating = false
                }
            }
        }
    }
}
If we run our application now, we can see that our UI is at least no longer freezing:
This starts to look great, but it’s still taking a very long time to generate those wallpapers.
Let’s have a look into instruments:
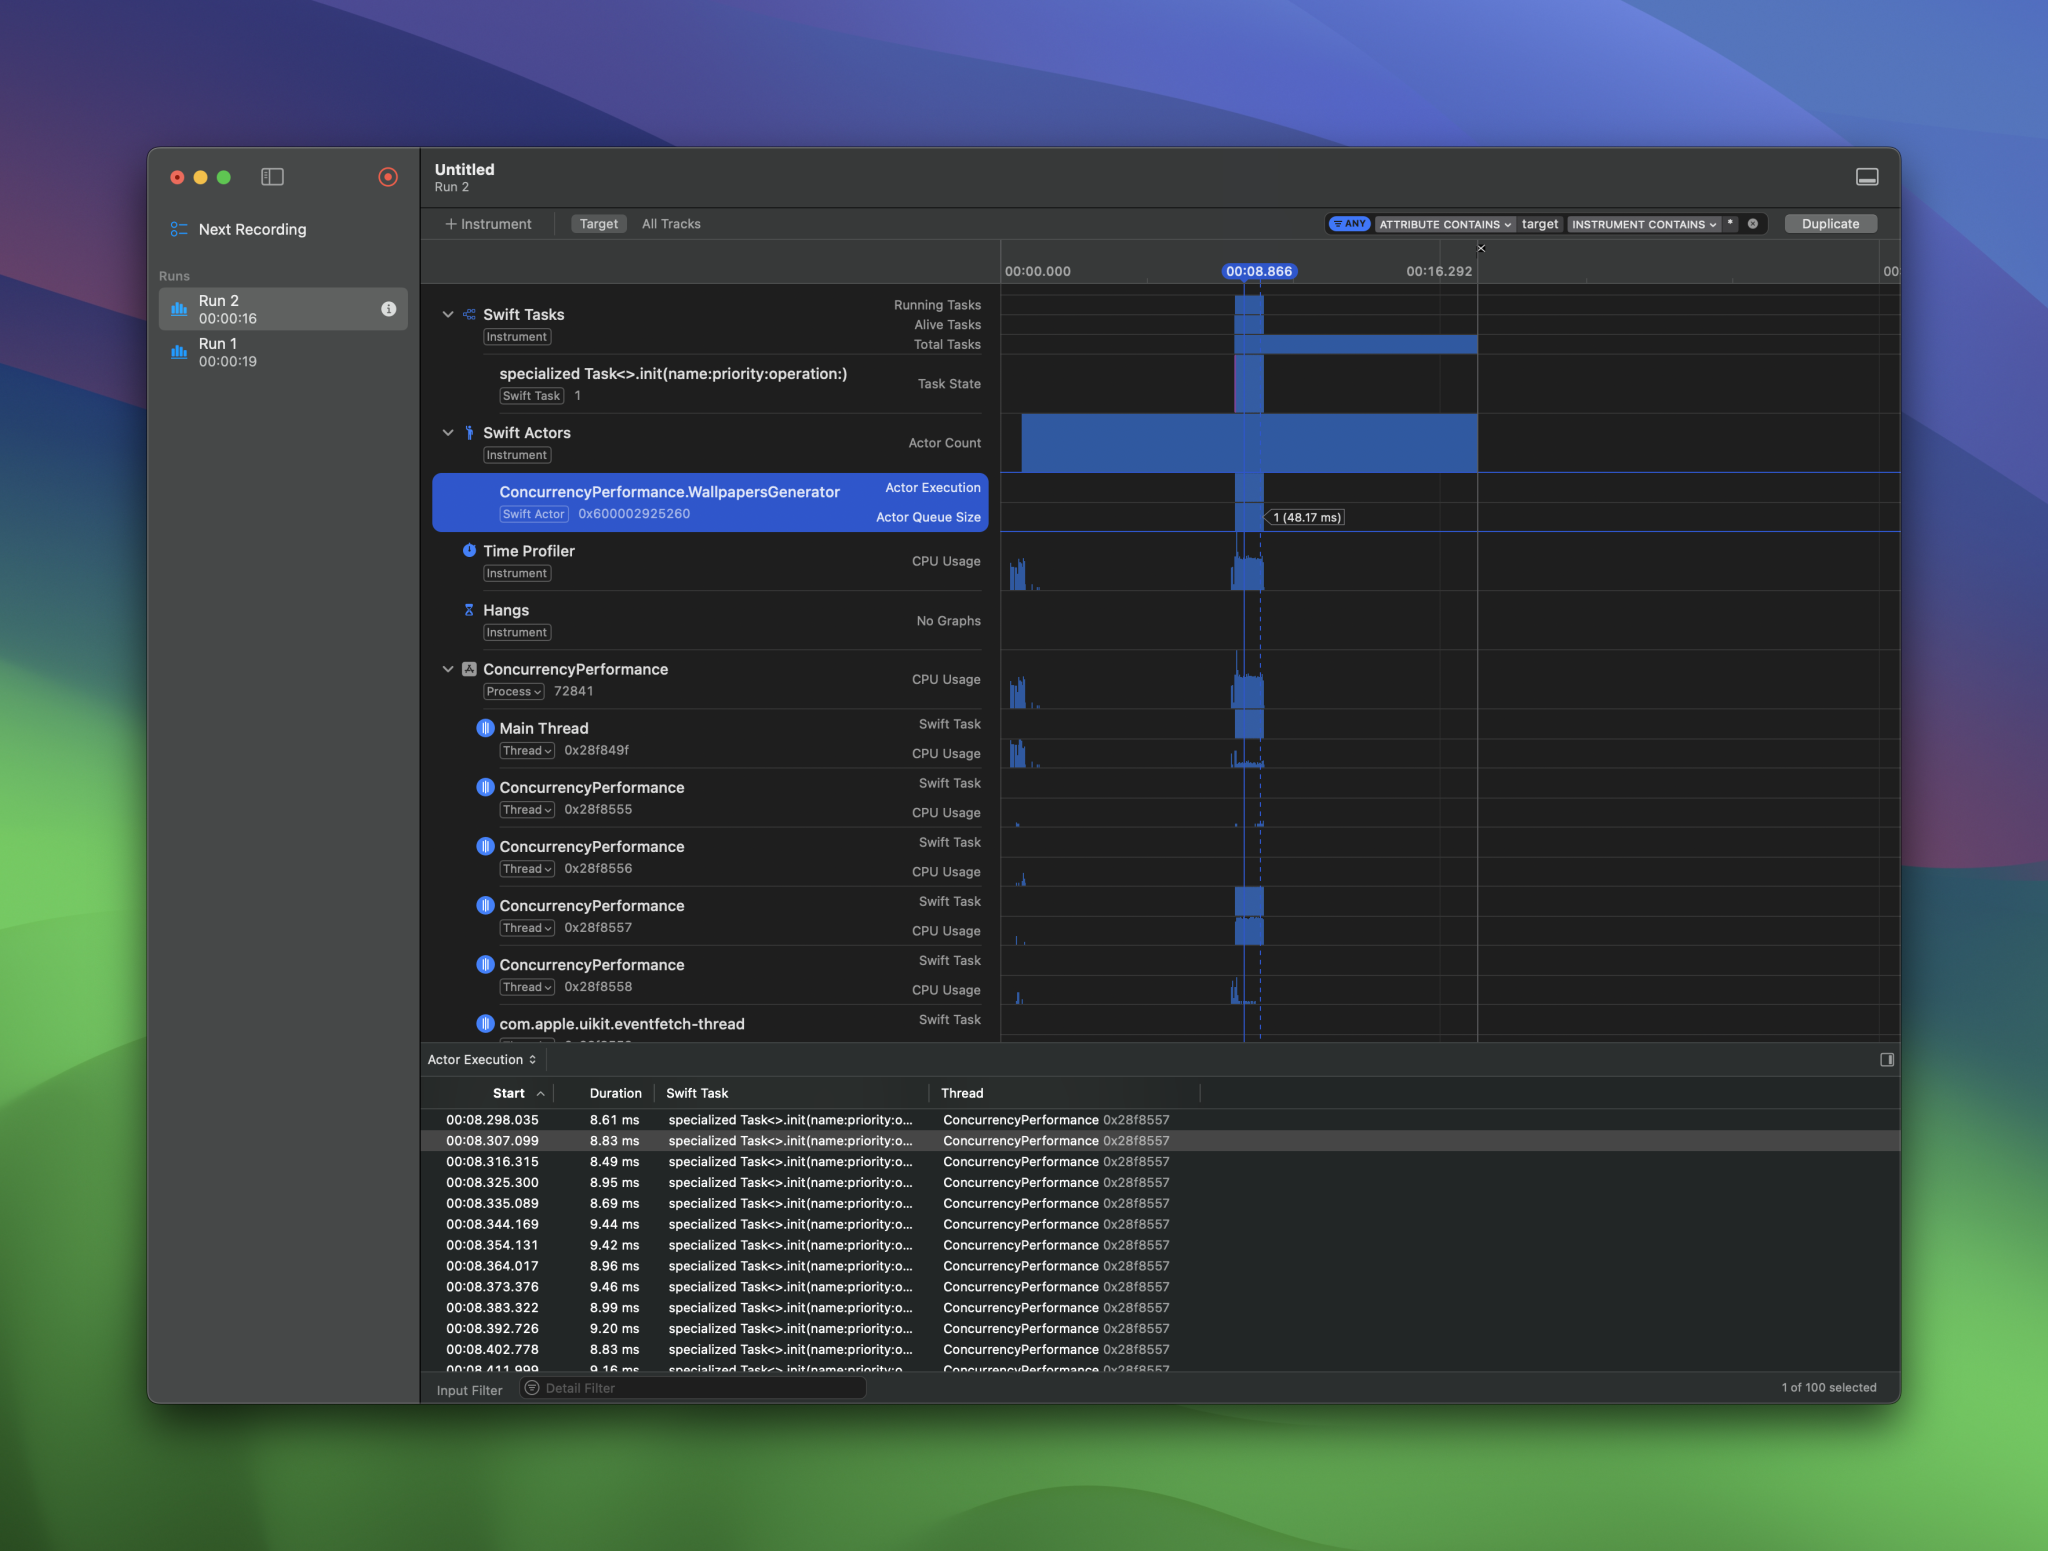
We can see that our actor’s queue size never exceeds 1. This is because we’re running one task at a time. We did move work away from the main thread, which aligns with what we’ve seen in the video.
Running wallpaper generation in parallel
Let’s continue optimizing and run wallpaper generation in parallel. The first thing you might consider doing is introducing a task group:
func regenerateWallpapers_v3() {
    wallpapers.removeAll()
    isGenerating = true

    Task {
        await withTaskGroup { group in
            for index in 0..<numberOfWallpapersToGenerate {
                group.addTask(name: "Wallpaper \(index)") {
                    let wallpaper = await self.wallpapersGenerator.generate()
                    return wallpaper
                }
            }

            for await wallpaper in group {
                wallpapers.insert(wallpaper, at: 0)

                if self.wallpapers.count == self.numberOfWallpapersToGenerate {
                    self.isGenerating = false
                }
            }
        }
    }
}
Note
I’m introducing _v3 here as you might noticed. This is because I’ve added all iterations individually to the sample code, so it’s easier for you to follow along.
Running this code optimization in instruments shows something interesting:
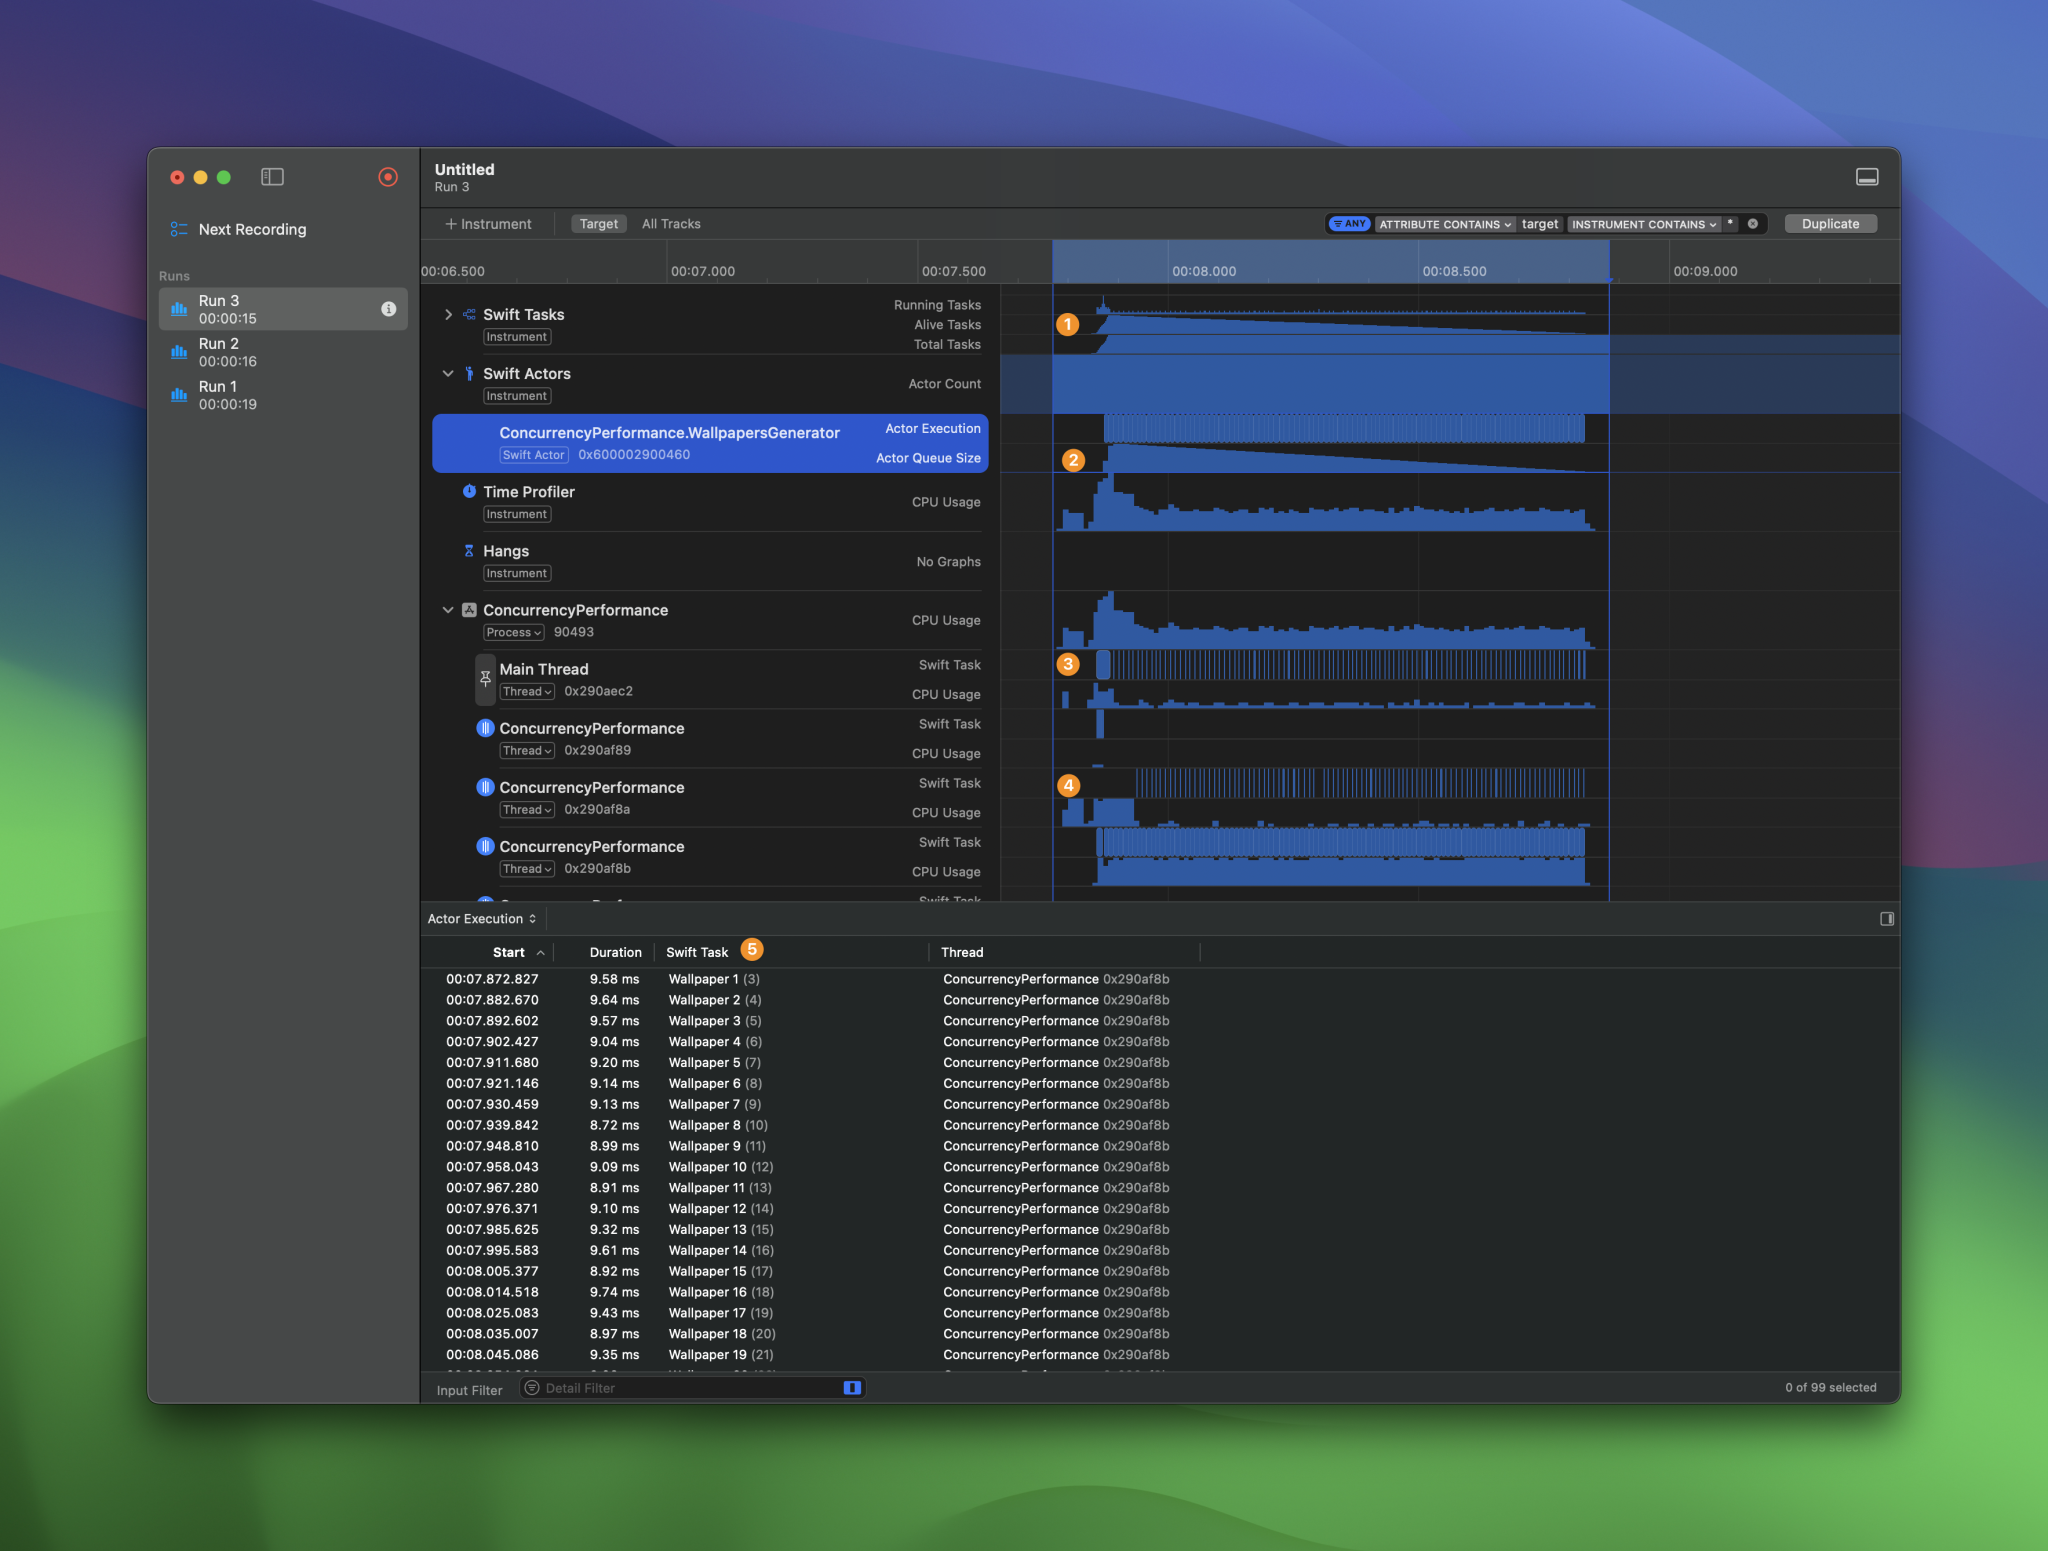
Let’s discuss:
- The number of Swift Tasks starts at a high number and lowers one-by-one
- The same happens for the actor. We start with a high queue, and we go down one-by-one
- We can see that the main thread gets activity one-by-one
- A background thread is doing some work one-by-one
- Each wallpaper gets generated one-by-one
Neat little tip: Notice that our custom name "Wallpaper \(index)" allows us to easily indicate the tasks inside instruments.
You might guess here, but the one-by-one is crucial here. Even though we’ve optimized for parallelization, we still don’t generate wallpapers simultaneously. This is caused by the fact that we’re still using an actor in-between:
actor WallpapersGenerator {
    func generate() -> Wallpaper {
        let generator = BadGradientWallpaperGenerator(
            width: 640,
            height: 360,
            controlPointCount: 2,
            nearestPointsToSample: 1
        )

        let image = generator.generate()
        return Wallpaper(image: image)
    }
}
I introduced this actor on purpose to better demonstrate you the iteration of performance optimizations. Sometimes a solution looks like a good way to go, but instruments will tell you it’s not.
Optimizing parallel execution by removing the actor
The fun fact is: we don’t even need an actor anymore. There’s no shared mutable state inside the WallpapersGenerator, so it’s safe to say we can run without it. There are a few alternatives to consider:
Task.detachedHas the downside of being unstructured@concurrentInstructing Swift to run our code in the background
I prefer to go with the latter, so I introduce a new wallpaper generator:
struct ConcurrentWallpaperGenerator {
    @concurrent
    static func generate() async -> Wallpaper {
        let generator = BadGradientWallpaperGenerator(
            width: 640,
            height: 360,
            controlPointCount: 2,
            nearestPointsToSample: 1
        )

        let image = generator.generate()
        return Wallpaper(image: image)
    }
}
Note the use of @concurrent here so we switch away from the @MainActor isolation domain.
We can also simplify our earlier code by removing the task group. A task group would be helpful in case we want to handle group cancellation or reduce the result. However, for our current case, a simple task will do:
func regenerateWallpapers_v4() {
    wallpapers.removeAll()
    isGenerating = true

    for index in 0..<numberOfWallpapersToGenerate {
        Task(name: "Wallpaper \(index)") {
            let wallpaper = await ConcurrentWallpaperGenerator.generate()

            self.wallpapers.insert(wallpaper, at: 0)

            if self.wallpapers.count == self.numberOfWallpapersToGenerate {
                self.isGenerating = false
            }
        }
    }
}
The result of all these performance improvements is quite impressive:
Summary
While your code might be compiling successfully without any warnings, you can still easily make mistakes that reduce the performance of your app. It’s essential to look at main thread usage, parallelization, and actor optimization. If done right, you can drastically improve your app’s performance.
Note
A small teaser: We can improve the performance even more. You’ll find out later in this course module!
In the next lesson, we’re going to look into reducing suspension points.